Clustering
Preface
All the executions and plots are generated from scratch at build time. This means results may vary from execution to execution.
This also creates some constraints in terms of execution time. A proper analysis would have us execute each approach many times prior to making any generalization, which we cannot afford here.
While I could use the same seed for the random generator and therefore generate reproducible results, this wouldn’t be befitting of a demonstration of evolutionary algorithms.
Note also the purpose of this document is to serve me as notes and is not meant to be taken as exhaustive or a fully fledged blog post.
Introduction
Clustering is the task of grouping elements which are similar. It is a useful technique to summarize, segement or contrast a dataset. One of the most popular algorithm to go about it is called K-means clustering. It is based on representatives which partition the space and the data is grouped based on which representative it is the most similar to.
In this example, we will use a Genetic algorithm based approach for the detemination of the best representatives for a set of 2D points. We will use the euclidian distance as the method to measure their similarities.
Solving that challenge means we will need a few things:
- We need to generate a dataset that we can cluster
- We need to figure out a good way to represent our population of clusters, which are our solutions
- We need to establish a way to grade our clusters, which is our fitness evaluation function
- We will also have to configure our evolution with some sensible policies for selection, combination and mutation
Project setup
In order to do our clustering, we do need a dataset. To that end, we will generate multiple groups of 2D points.
The dataset is generated by first generating some random centroids:
public static double[][] generateClusters(final Random random, final int numClusters, final double minX,
                final double maxX, final double minY, final double maxY) {
        Objects.requireNonNull(random);
        Validate.isTrue(numClusters > 0);
        Validate.isTrue(minX <= maxX);
        Validate.isTrue(minY <= maxY);

        logger.info("Generating {} clusters", numClusters);

        final double[][] clusters = new double[numClusters][2];
        for (int i = 0; i < numClusters; i++) {
                clusters[i][0] = minX + random.nextDouble() * (maxX - minX);
                clusters[i][1] = minY + random.nextDouble() * (maxY - minY);
        }

        return clusters;
}
And then we will generate a few hundred data points around these centroids:
public static double[][] generateDataPoints(final Random random, final double[][] clusters, final int numDataPoints,
                final double radius) {
        Objects.requireNonNull(random);
        Objects.requireNonNull(clusters);
        Validate.isTrue(clusters.length > 0);

        final int numClusters = clusters.length;
        final double[][] data = new double[numDataPoints][3];
        for (int i = 0; i < numDataPoints; i++) {
                final int clusterIndex = i % numClusters;

                data[i][0] = random.nextGaussian() * radius + clusters[clusterIndex][0];
                data[i][1] = random.nextGaussian() * radius + clusters[clusterIndex][1];
                data[i][2] = clusterIndex;
        }

        return data;
}
Here is how the resulting data would look like:
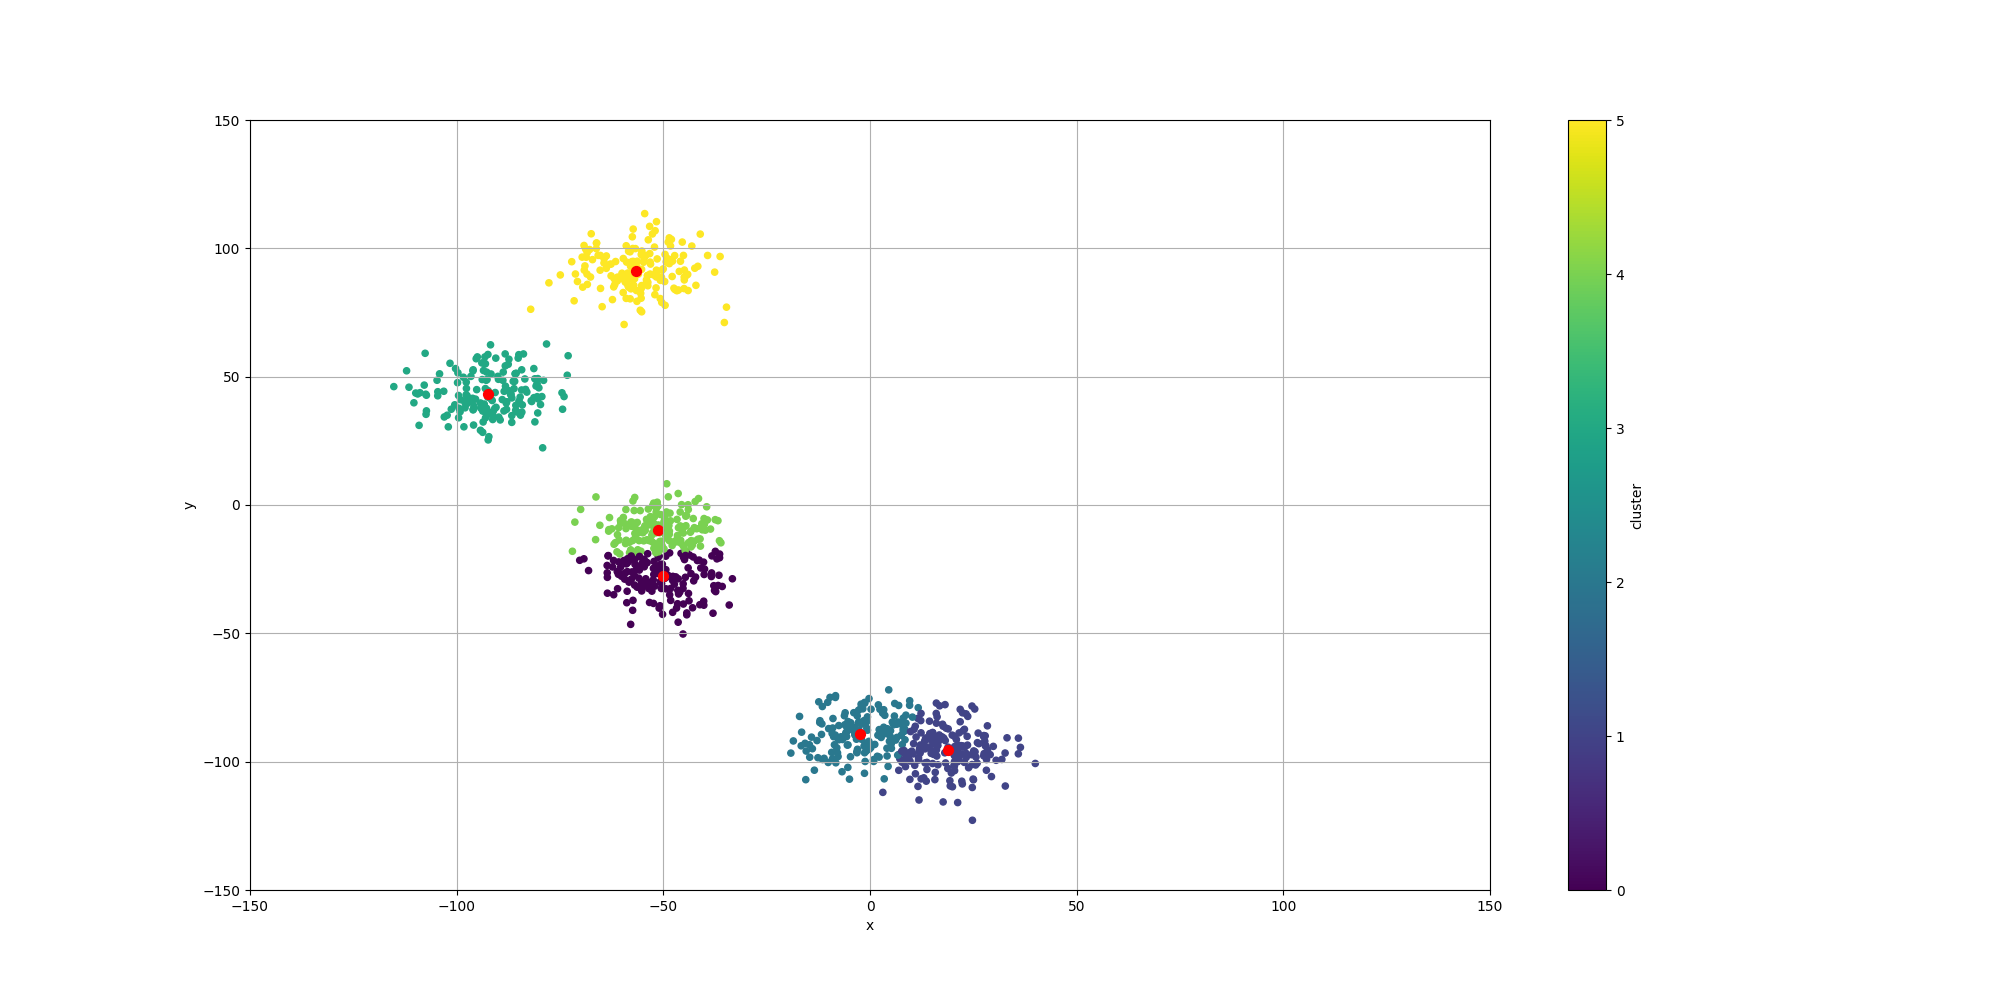
Note how some of the clusters are really close to each others and could actually be considered as one. This will have an impact in the way the algorithms decide to cluster them and it will be interesting to observe how each algorithm decides to approach that ambiguity.
Baseline - K-means
We want to compare our results with the ones produced by the most popular clustering algorithm: K-means. The results can vary quite a bit for each run since the results are highly dependent on the initial placement of the centroids. Furthermore, all the clusters will be used, which means that depending on the starting point, it may decide to cluster the data differently.
Here is the output of such execution:
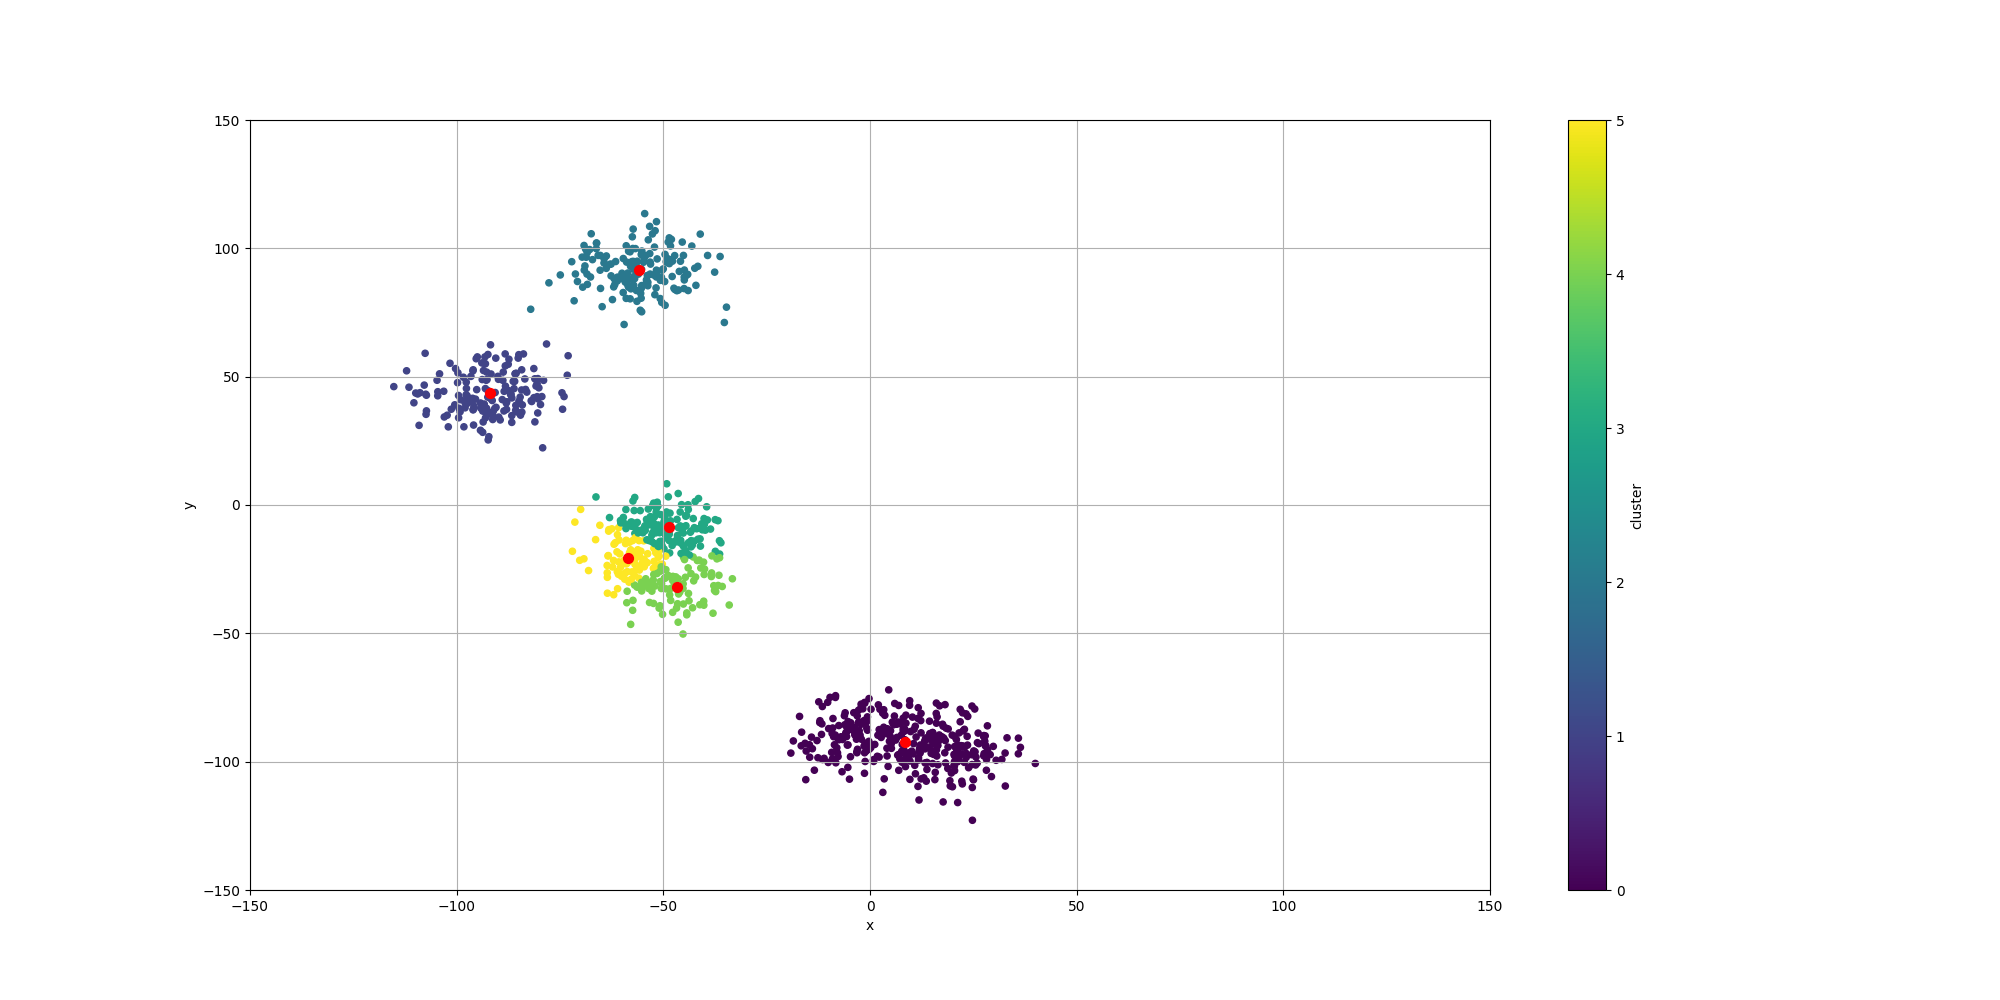
Over the course of multiple executions, K-Means has always broken apart some of the clusters. Sometimes, it would even split one cluster in 3. This is expected as k-means has no quantification of the quality of a cluster and the centroids would only be attracted to the closest mass of data points.
With regards to the summarization, we observe the centroids are indeed pretty close to the center of their associated data points.
Evolutionary Algorithm
Representation
We can represent our set of clusters, each defined by a centroid with coordinates \$(x, y)\$, as a real valued chromosome. We can linearize the coordinates and form a vector such as \$(C_(0,x), C_(0,y), C_(1,x), C_(1,y), ..., C_(n,x), C_(n,y))\$.
Converting back such representation to a set of coordinate would mean putting them back together. Here is the code used:
public static double[][] toPhenotype(final Genotype genotype) {
        Objects.requireNonNull(genotype);
        Validate.isTrue(genotype.getSize() > 0);

        final var doubleChromosome = genotype.getChromosome(0, DoubleChromosome.class);

        final int numClusters = doubleChromosome.getSize() / 2;
        final double[][] clusters = new double[numClusters][2];

        for (int i = 0; i < numClusters; i++) {
                clusters[i][0] = doubleChromosome.getAllele(i * 2);
                clusters[i][1] = doubleChromosome.getAllele(i * 2 + 1);
        }

        return clusters;
}
Evaluation
In order to evaluate the quality of a given solution, we will use the Silhouette score. It establishes a measure of how data points are similar to their own clusters comparing to other clusters. The silhouette score is computed on a per data point basis and ranges from -1 to 1 and the higher value, the better clustering.
As we want to maximize the placement for all the points, we will use the sum of the silhouette score across all the data points as our final fitness score. This is a different approach from scikit-learn which would the mean silhouette score when evaluating a solution.
To compute the silhouette score, we will need to compute \$a(i)\$ and \$b(i)\$. We will also define the following:
- \$d(i, j)\$ represents the distance between the two 2D points i and j
- We have k clusters \$C^0...C^(k-1)\$
- In the context of a data point i, the cluster it belongs to would be denoted as \$C_i\$
\$a(i)\$ represents the mean distance of the points with all the other members of the same cluster. It is defined as \$a(i) = 1 / (abs(C_i) - 1) sum_(j in C_i, i!=j) d(i, j)\$, which translates to:
private static double aI(final double[][] data, final double[][] distances,
                final Map<Integer, Set<Integer>> clusterToMembers, final int clusterIndex, final int i) {
        Objects.requireNonNull(data);
        Objects.requireNonNull(distances);
        Objects.requireNonNull(clusterToMembers);

        final var members = clusterToMembers.get(clusterIndex);

        double sumDistances = 0.0;
        for (final int memberIndex : members) {
                if (memberIndex != i) {
                        sumDistances += distances[i][memberIndex];
                }
        }

        return sumDistances / ((double) members.size() - 1.0d);
}
\$b(i)\$ represents the minimum of the average distances with the data points of every other cluster. It is defined as \$b(i) = min_(k!=i) 1 / abs(C_k) sum_(j in C_k) d(i, j)\$, which translates to:
private static double bI(final double[][] data, final double[][] distances,
                final Map<Integer, Set<Integer>> clusterToMembers, final int numClusters, final int clusterIndex,
                final int i) {
        Objects.requireNonNull(data);
        Objects.requireNonNull(distances);
        Objects.requireNonNull(clusterToMembers);
        Validate.isTrue(numClusters > 0);
        Validate.inclusiveBetween(0, numClusters - 1, clusterIndex);

        double minMean = -1;
        for (int otherClusterIndex = 0; otherClusterIndex < numClusters; otherClusterIndex++) {

                if (otherClusterIndex != clusterIndex) {

                        final var members = clusterToMembers.get(otherClusterIndex);

                        if (members != null && members.isEmpty() == false) {
                                double sumDistances = 0.0;
                                for (final int memberIndex : members) {
                                        sumDistances += distances[i][memberIndex];
                                }

                                final double meanDistance = sumDistances / members.size();

                                if (minMean < 0 || meanDistance < minMean) {
                                        minMean = meanDistance;
                                }
                        }
                }
        }

        return minMean;
}
Finally the silhouette score is put together by computing \$"Silhouette"(i) = (b(i) - a(i)) / (max {a(i), b(i)})\$
The fitness evaluation function will co
public static Fitness<Double> computeFitness(final int numDataPoints, final double[][] data, double[][] distances,
                final int numClusters) {
        Objects.requireNonNull(data);
        Objects.requireNonNull(distances);
        Validate.isTrue(numDataPoints > 0);
        Validate.isTrue(numDataPoints == data.length);
        Validate.isTrue(numDataPoints == distances.length);
        Validate.isTrue(numClusters > 0);

        return genoType -> {

                final double[][] clusters = PhenotypeUtils.toPhenotype(genoType);

                final int[] closestClusterIndex = assignDataToClusters(data, distances, clusters);

                final Map<Integer, Set<Integer>> clusterToMembers = new HashMap<>();

                for (int i = 0; i < numDataPoints; i++) {
                        final var members = clusterToMembers.computeIfAbsent(closestClusterIndex[i], k -> new HashSet<>());
                        members.add(i);
                }

                double sum_si = 0.0;
                for (int i = 0; i < numDataPoints; i++) {
                        sum_si += computeSilhouetteScore(data, distances, numClusters, clusterToMembers, closestClusterIndex, i);
                }

                return sum_si;
        };
}
Fitness Sharing
K-means and Genetic Algorithms share a similar issue about possibly focusing on a local maximum and missing a better solution. To that end, we will make use of Fitness Sharing and use the accumulated distance between each cluster as the distance function between two solution. This will make the evolutionary process lower the scores of similar solutions and thus ensure more diversity in the population.
The fitness sharing is therefore defined as:
public static final FitnessSharing clusterDistance = FitnessSharing.ofStandard((i0, i1) -> {
        final var cluster0 = PhenotypeUtils.toPhenotype(i0);
        final var cluster1 = PhenotypeUtils.toPhenotype(i1);

        double distanceAcc = 0.0D;
        for (int i = 0; i < cluster0.length; i++) {
                double distance = 0.0D;
                distance += (cluster1[i][0] - cluster0[i][0]) * (cluster1[i][0] - cluster0[i][0]);
                distance += (cluster1[i][1] - cluster0[i][1]) * (cluster1[i][1] - cluster0[i][1]);

                distanceAcc += Math.sqrt(distance);
        }

        return distanceAcc;
}, 5.0);
Configuration
The policies we will use are:
- Selection: tournaments of 2 individuals
- Combination: combintion of multi-point arithmetic and multi-point crossovers
- Mutation: combination of random and creep mutations
- Maximization of the fitness score since a higher silhouette score indicates a better clustering
Putting it all together, the configuration is defined as:
final var eaConfigurationBuilder = new EAConfiguration.Builder<Double>();
eaConfigurationBuilder.chromosomeSpecs(DoubleChromosomeSpec.of(k * 2, min, max))
                .parentSelectionPolicy(Tournament.of(numberTournaments))
                .combinationPolicy(
                                MultiCombinations.of(
                                                MultiPointArithmetic.of(combinationArithmetic, 0.5),
                                                        MultiPointCrossover.of(combinationCrossover)))
                .mutationPolicies(
                                MultiMutations.of(
                                                RandomMutation.of(randomMutationRate),
                                                        CreepMutation.ofNormal(creepMutationRate, creepMutationMean, creepMutationStdDev)))
                .fitness(fitnessFunction)
                .postEvaluationProcessor(FitnessSharingUtils.clusterDistance)
                .termination(terminations);
final var eaConfiguration = eaConfigurationBuilder.build();
Results
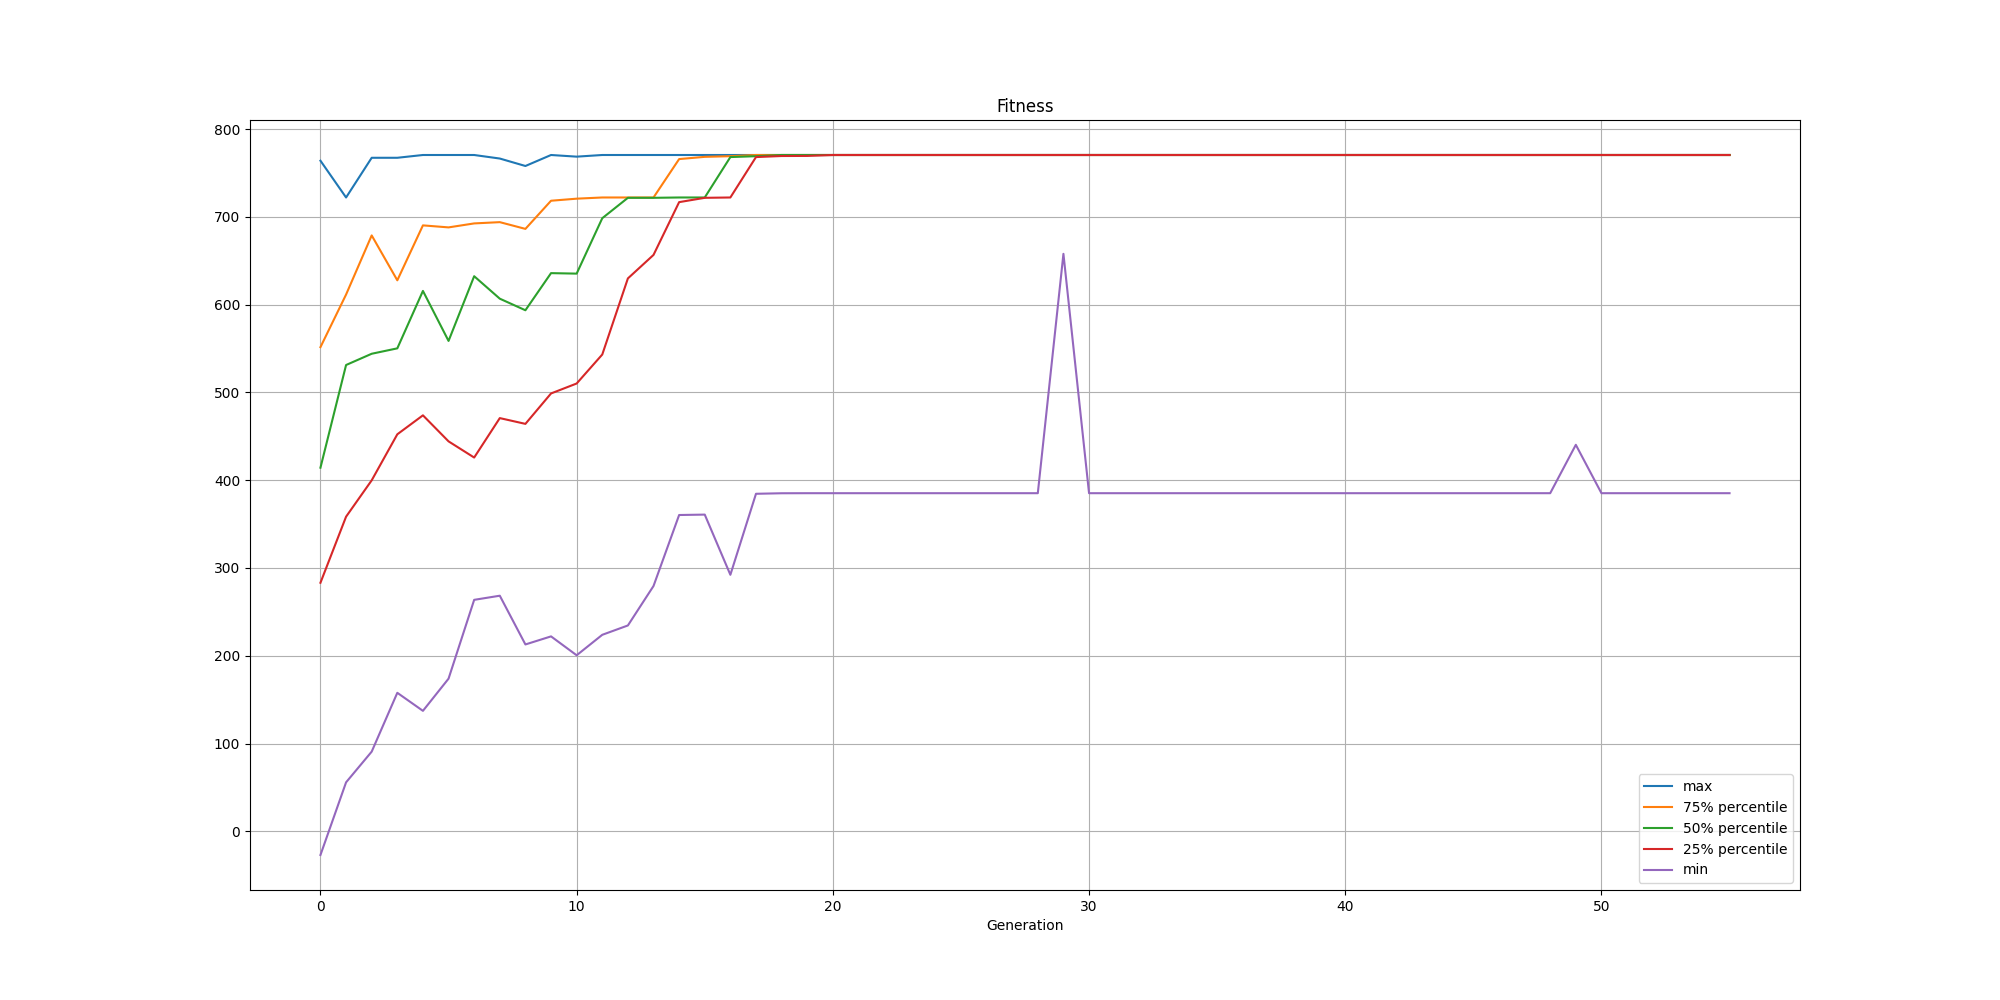
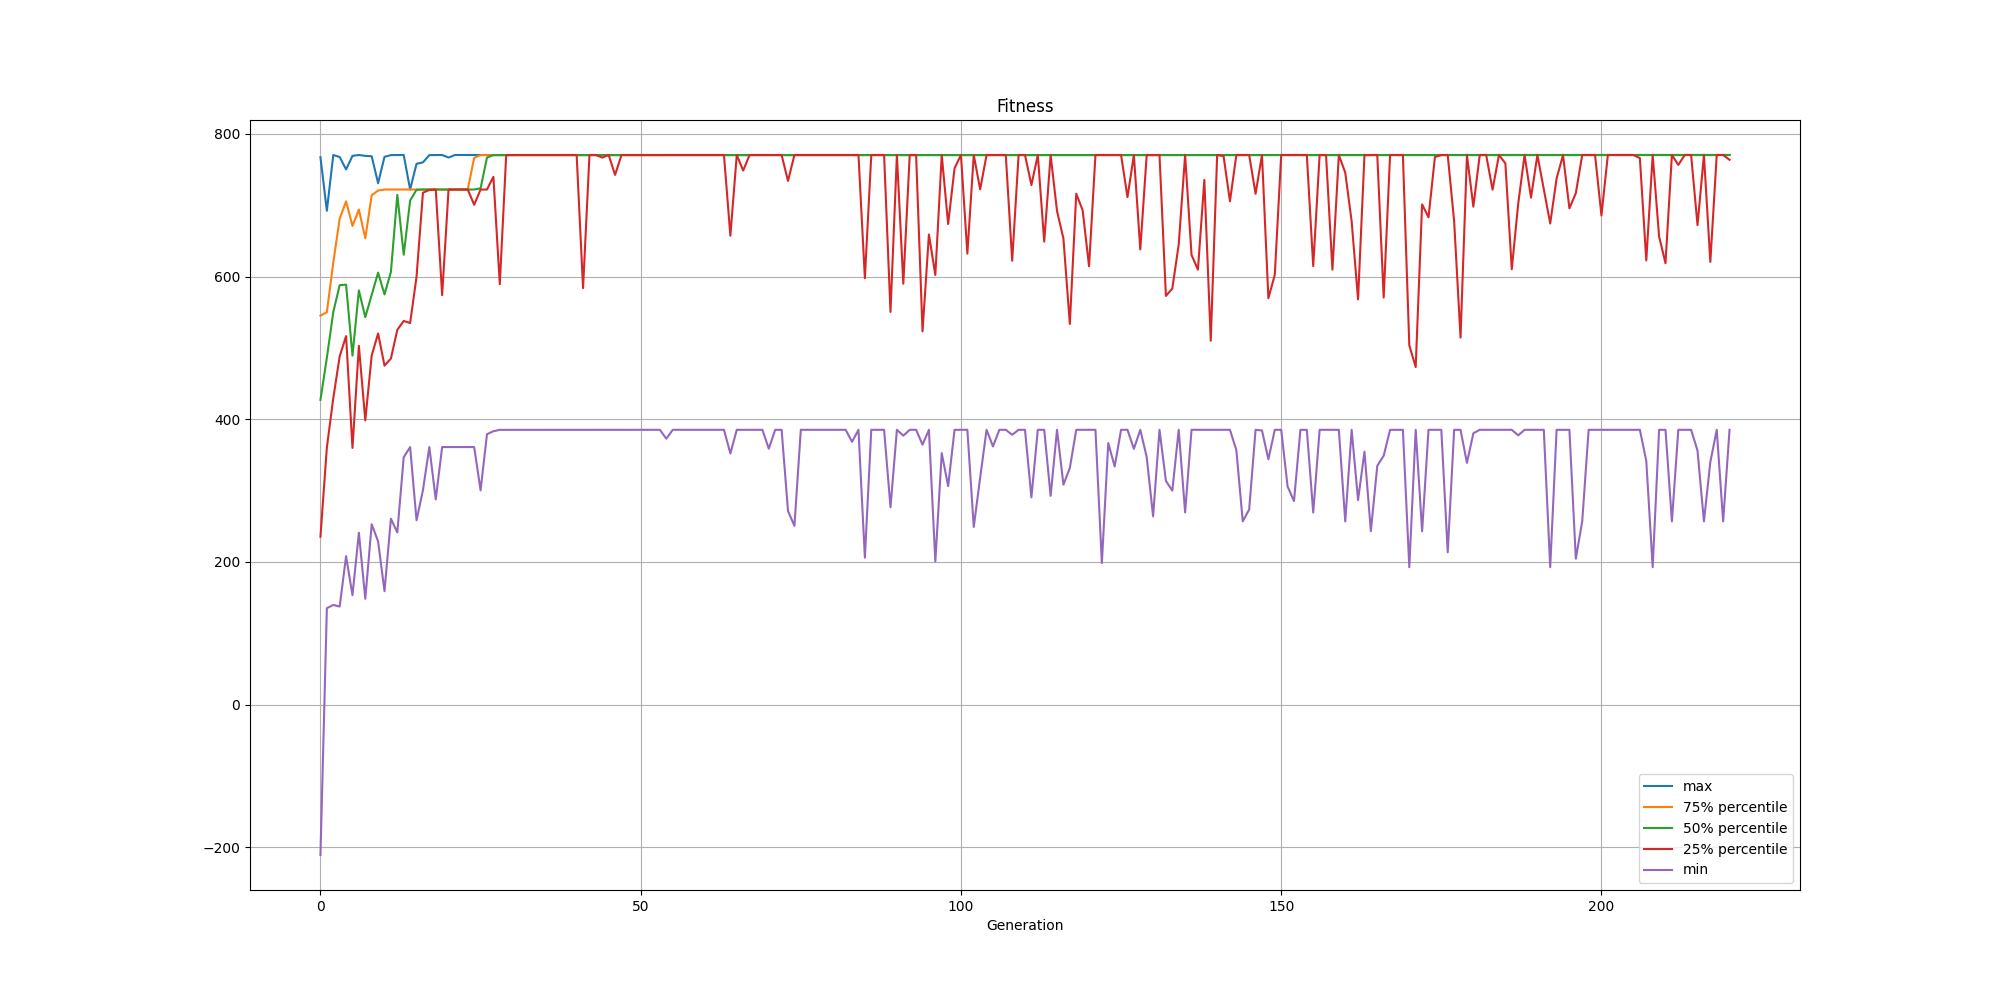
Since we use the silhouette score, the population will do its best to maximize the quality of the clusters. The fitness improves pretty quickly and then fine tune the results. Here is an example of evolution of the fitness over time:
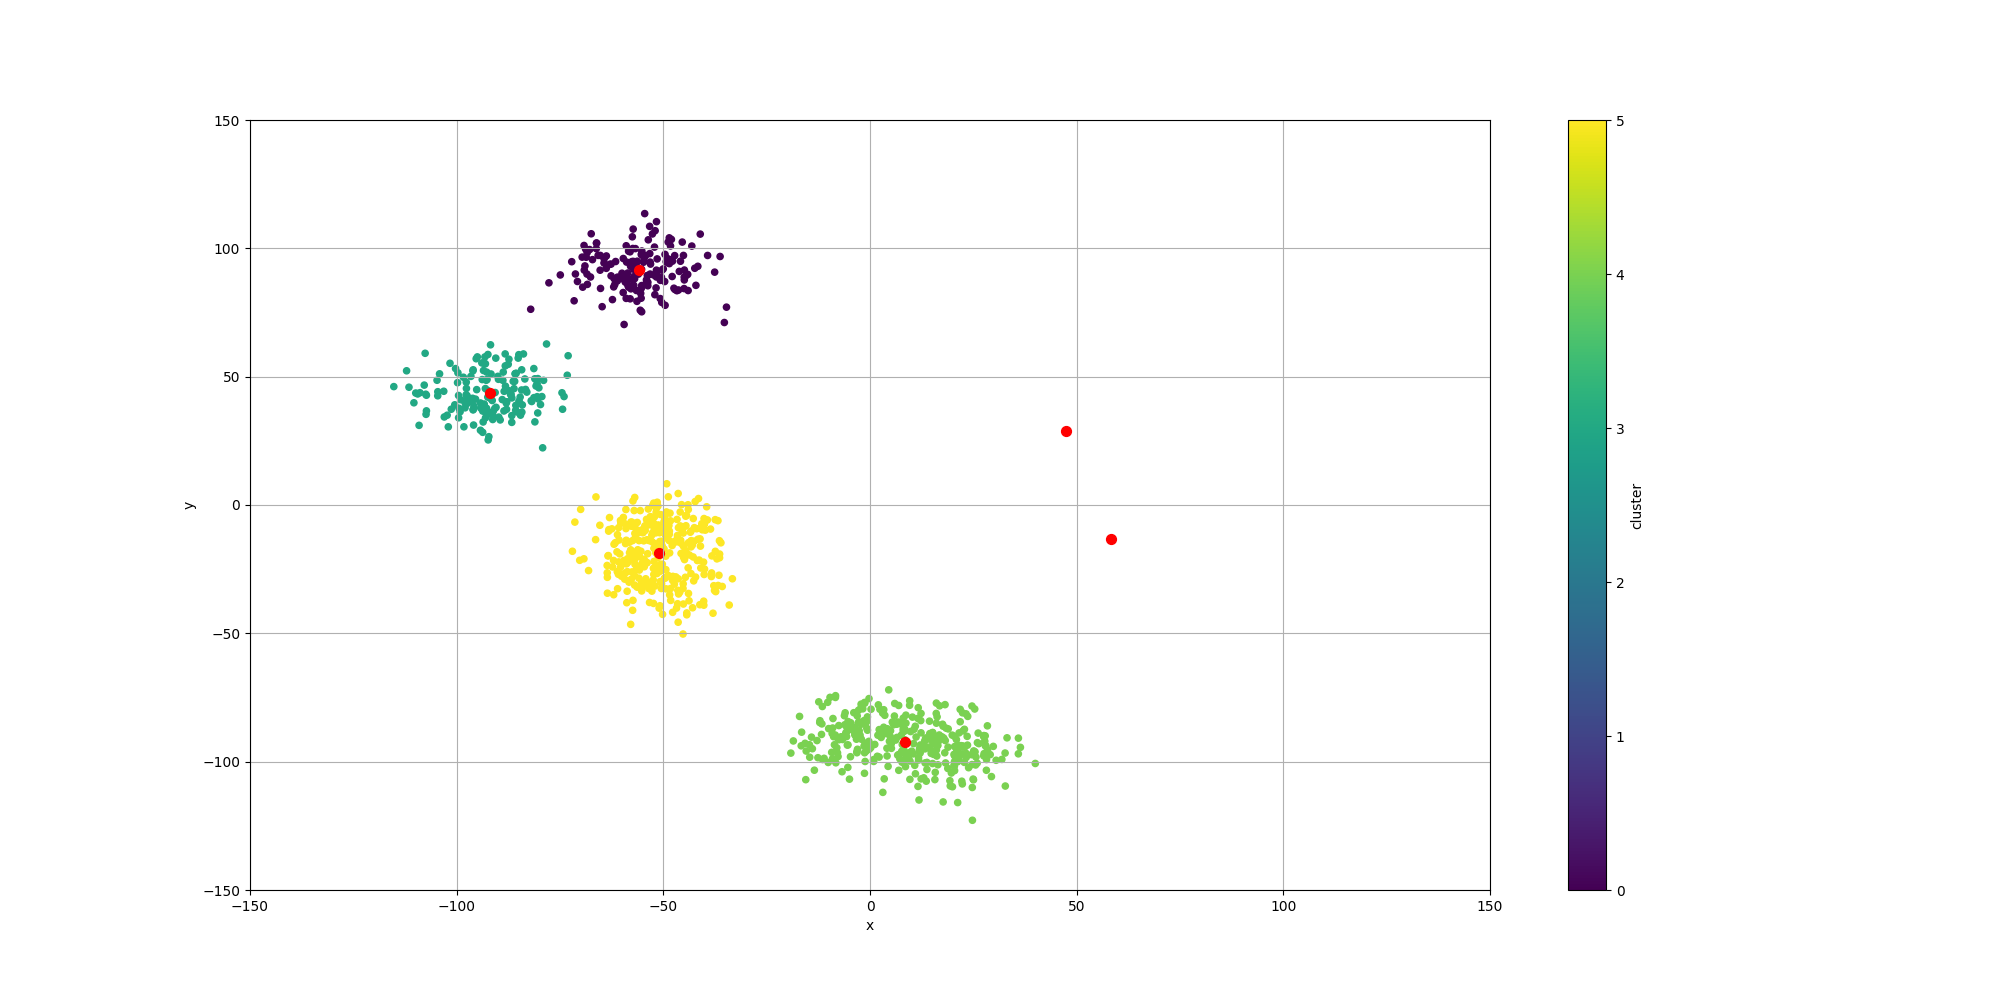
With regards to the clustering itself, while the clusters are pretty well defined, we do observe some surprising results for the centroids:
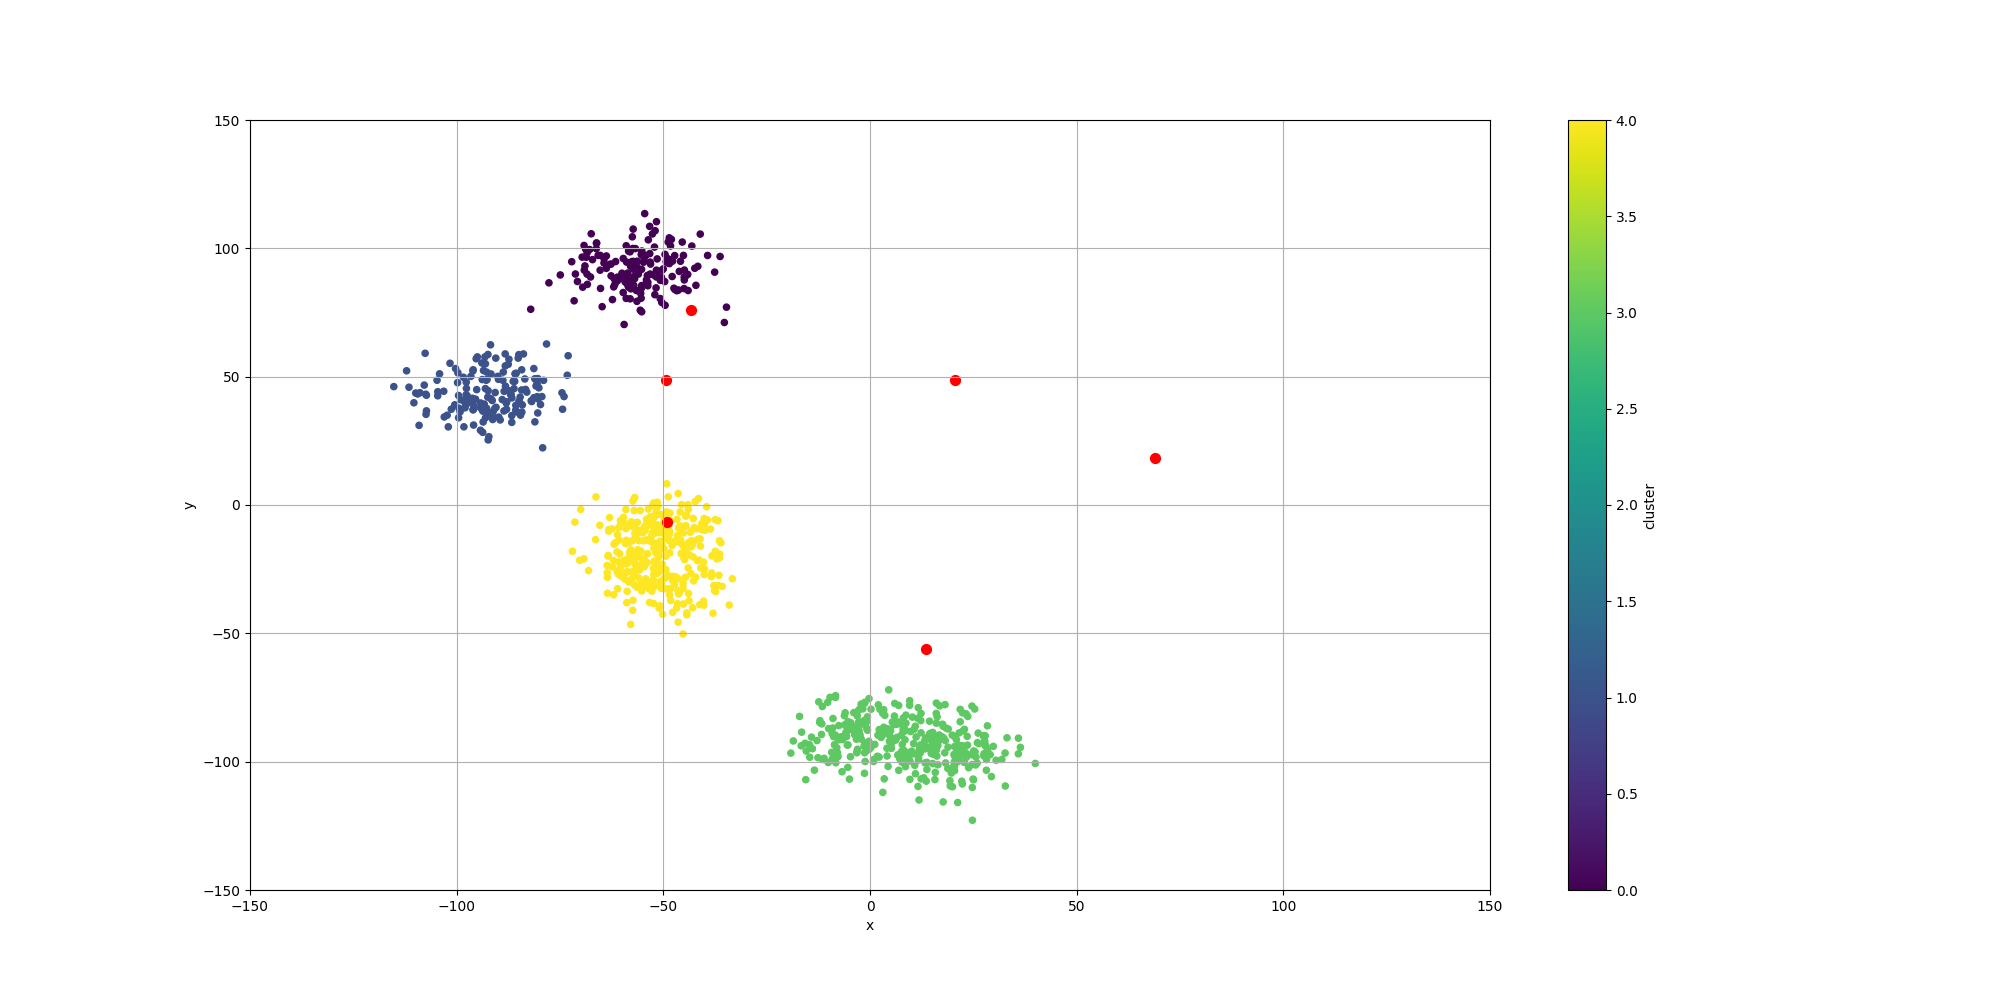
We observe the following:
- Two of the centroids have no relationship to any of the data points. This can be interpreted as the population moving them so far away that they cannot be associated with any of the data points. This is a way to reduce the clustering to only 4 clusters
- None of the centroids are centered over their associated clusters. This would not be useful as a way to summarize them
The second point is very interesting and quite logical for the following reason:
K-means has an explicit step of moving the centroids closer to their associated data points. Our approach does not have that constraint. If we look closely at our evaluation metric, it does not say anything about the centroids. The silhouette score only characterize the data points within the same clusters to the data points outside of it. Therefore the location of the centroids does not matter as long as they are close enough to have the right data points form the best membership.
Improving the location of the centroids
If we want our centroids to better represent their clusters, then we need to add such criteria to our evaluation function. This will make the evolutionary process favor solutions with better placed centroids. Therefore the evaluation function for the population will add a new term which favor centroids closer to their data points. This could be expressed as \$sum_(i=1)^k sum_(j in C^i)d(C^i, j)^2\$.
Note that we have to use the inverse of the SSE since we want to maximize the fitness score. This makes solutions with larger SSEs smaller less attractive than solutions with smaller SSEs.
Here is the updated fitness function with the additional term:
public static Fitness<Double> computeFitnessWithSSE(final int numDataPoints, final double[][] data,
                double[][] distances, final int numClusters) {
        Objects.requireNonNull(data);
        Objects.requireNonNull(distances);
        Validate.isTrue(numDataPoints > 0);
        Validate.isTrue(numDataPoints == data.length);
        Validate.isTrue(numDataPoints == distances.length);
        Validate.isTrue(numClusters > 0);

        return genoType -> {

                final double[][] clusters = PhenotypeUtils.toPhenotype(genoType);

                final int[] closestClusterIndex = assignDataToClusters(data, distances, clusters);

                final Map<Integer, Set<Integer>> clusterToMembers = new HashMap<>();

                for (int i = 0; i < numDataPoints; i++) {
                        final var members = clusterToMembers.computeIfAbsent(closestClusterIndex[i], k -> new HashSet<>());
                        members.add(i);
                }

                double sum_si = 0.0;
                for (int i = 0; i < numDataPoints; i++) {
                        sum_si += computeSilhouetteScore(data, distances, numClusters, clusterToMembers, closestClusterIndex, i);
                }

                final double sumSquaredError = computeSumSquaredErrors(
                                data,
                                        distances,
                                        clusters,
                                        clusterToMembers,
                                        closestClusterIndex);

                return sum_si + (1.0 / sumSquaredError);
        };
}
Results
Now that we have added that constraint, the population will not only look for solutions with better silhouette scores but also the ones where their centroids minimize the distances between the centroids and their associated data points.
We can observe the fitness still converges as fast as previously, but does take longer to stabilize. This could be attributed to the fact we are including two different objectives in our fitness function and their scales can be pretty different. To improve it, we could look into different paths:
- Use a different scoring method than silhouette which would not only look at the clustering but also the location of the centroids. Davies–Bouldin index looks interesting in that regard
- Revisit the different methodologies used for multi-objectives optimization problems. See 6 ways to handle your bloat issues
With regards to the clustering and the location of the centroids, we can indeed observe much better results:
Conclusion
Genetic Algorithms can be pretty effective at clustering data without making some assumption about the underlying dataset. This can be especially be useful in more complex scenario.
However it can take a bit longer than k-means since it may take a few dozens generations to get to a sensible solution.
Going further
This is a rather simple example but there are tons of room for improvement.
- In this example we have a fixed number of clusters. However we could include the number of clusters as part of the evolution process
- We assume the groups have a perfect round shape, but that is not necessarily the case. We could explore using a Mahalanobis distance to account for more complex shapes.
- Instead of assuming centroids have a specific location, we could consider them instead as statistical distributions and thus a Mixture model
- We could evaluate other distance function for the Fitness Sharing. A better one could be devised since different locations could currently generate the same distance
- Density based clustering could be explored
- Explore the different paths listed to improve our fitness scoring method to generate the best clustering and best centroid location
- Exploring an hybrid model model between an evolutionary approach and k-means. K-means could be run on the best individuals as a way to converge faster to a solution, while keeping the exploratory approach of the evolutionary approach